01 · DOUBLE DIAMOND
Solve the right problem
Discover customer needs, define the problem and value proposition, explore solutions, and test the strongest ideas.
Outcome: A shared understanding of what to solve and why it matters.
My repeatable approach to product leadership: overlapping discovery and delivery, supported by lean experimentation throughout.
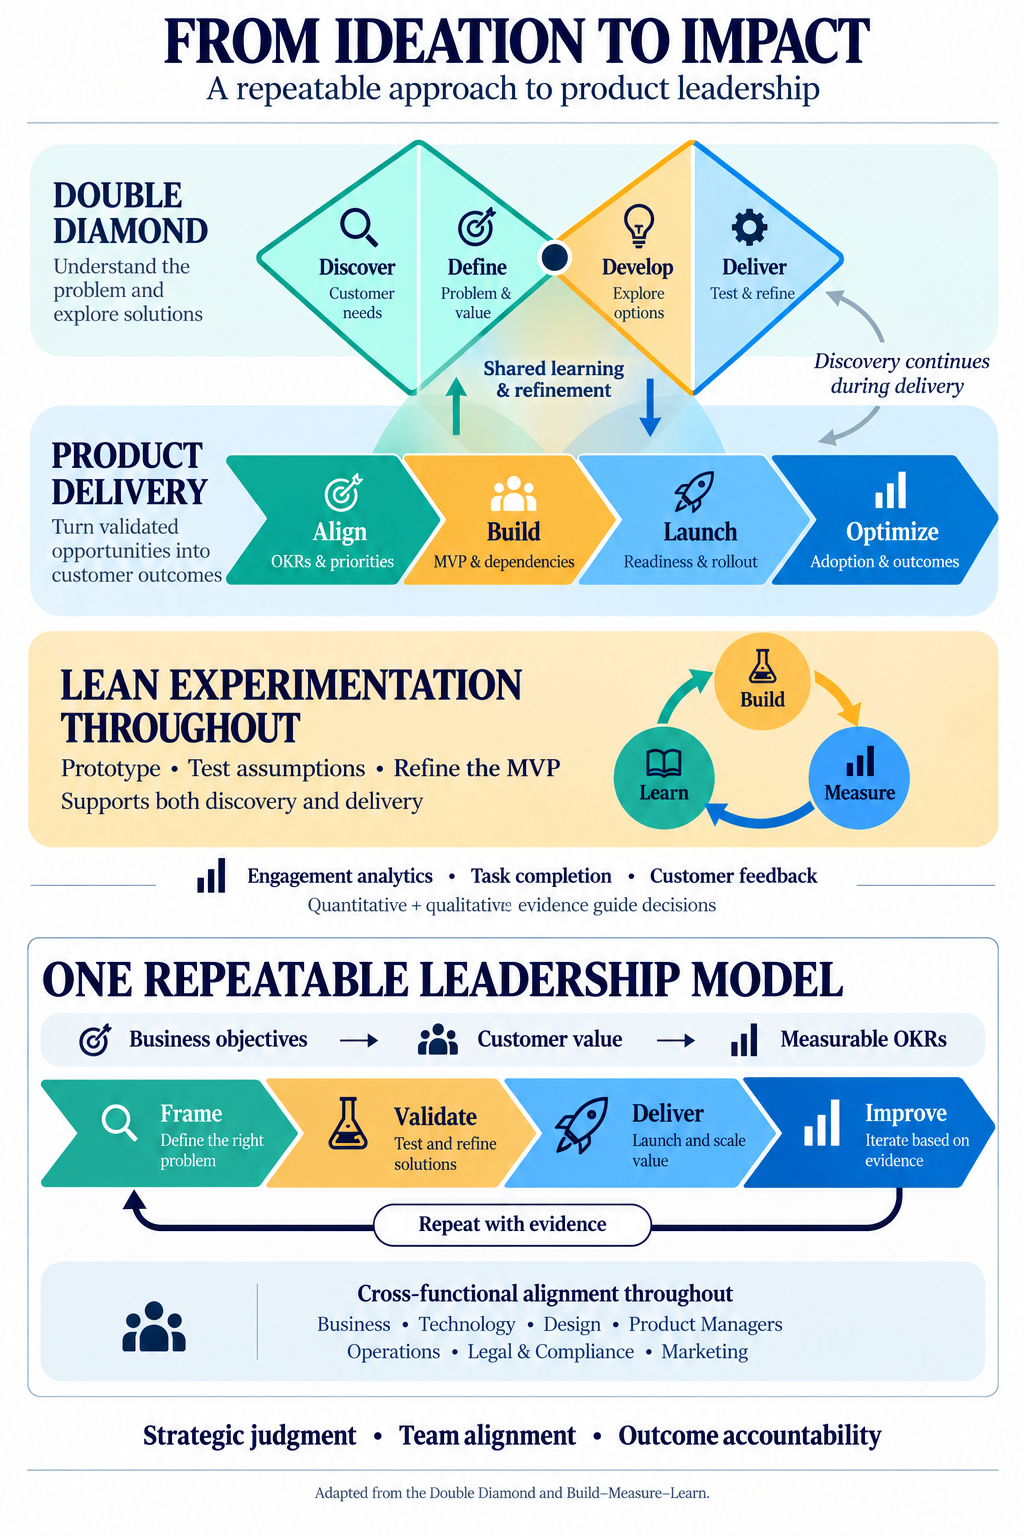
Double Diamond and product delivery overlap: learning and refinement continue as teams build, launch, and improve. Lean experimentation supports both.
Discover customer needs, define the problem and value proposition, explore solutions, and test the strongest ideas.
Outcome: A shared understanding of what to solve and why it matters.
Align priorities and OKRs, define a focused release, coordinate dependencies, and prepare for launch. Continue discovery and testing during implementation, then use adoption and outcomes to guide improvements.
Outcome: A coordinated release with clear ownership and success measures.
Use prototypes, POCs, and focused MVPs to test assumptions through Build–Measure–Learn. Combine quantitative evidence—engagement analytics and task completion—with qualitative feedback to assess whether the solution resolves the customer’s problem and decide what to refine next.
Outcome: Less uncertainty and evidence to guide investment.
I start by understanding where customers are struggling and why solving that problem matters to the business. Double Diamond helps me explore the problem and possible solutions, while lean experimentation helps the team test ideas and learn as we build.
I bring business stakeholders, Product, Design, Technology, Operations, Legal and Compliance, and Marketing together to agree on what matters, make tradeoffs, and define success through shared OKRs.
As we build and after we launch, I look at whether customers are using the product, completing their tasks, and finding it helpful. I combine those numbers with customer feedback to decide what to improve next—and connect those improvements to business results, such as fewer support calls, lower costs, or stronger retention.
The approach stays repeatable through clear decision points and lean through small tests, focused scope, and evidence-based priorities.
Each objective describes the customer or business outcome we want to improve. Its key results define the evidence of success, with a baseline, target, deadline, accountable owner, and agreed data source.
Example quarterly targets; actual baselines and targets must be agreed using validated data.
Tracking: Product owns the outcome review; Analytics validates event definitions and funnel data; Operations validates support-contact data. Review customer feedback alongside the dashboard, with reporting accuracy and error rates as guardrails.
Objective: Reduce the cost of serving customers.
Objective: Grow profitable customer engagement.
Engagement is a leading indicator. Retention, attributable revenue, and cost-to-serve establish whether it translates into financial value.
Better task completion → fewer assisted contacts → lower cost-to-serve → improved contribution.
At 100,000 active reporting customers, reducing contacts from 12 to 8 per 1,000 means 400 fewer contacts per month. At an assumed average handling cost of $8 per contact, that represents $3,200 per month in support workload value.
That is not automatically a $3,200 P&L saving. Finance and Operations confirm what becomes lower vendor charges, overtime, or other avoidable expense, versus capacity freed for other work. Subtract incremental product and operating costs when assessing net financial benefit.
Validate: Contact volume and handling costs with Operations; expense and revenue impact with Finance; engagement, completion, and retention with Analytics. Track repeat contacts, satisfaction, and accuracy so lower call volume reflects resolved needs.